Wedges in Trading: Reversal or Continuation Patterns Explained
🔍 Wedge patterns are powerful chart formations that leave many traders scratching their heads. Are they reversal signals? Or do they suggest trend continuation? The truth is – they can be both! This guide will give you the clarity you need to trade wedges profitably.
📌 What You’ll Learn
✅ What wedge patterns are
✅ Key differences between rising & falling wedges
✅ How to spot reversal vs continuation wedges
✅ Step-by-step trading strategies
✅ Common mistakes to avoid
🔍 What Are Wedge Patterns?
Wedge patterns are chart formations where price consolidates between two converging trendlines. Unlike flags/pennants, wedges can signal either:
✔ Trend reversals (most common)
✔ Trend continuations (in certain contexts)
📜 Key Characteristics
✔ Converging trendlines (both sloping in same direction)
✔ Declining volume during formation
✔ Breakout typically occurs in opposite direction of wedge slope
✔ Duration: Usually forms over 2-6 weeks
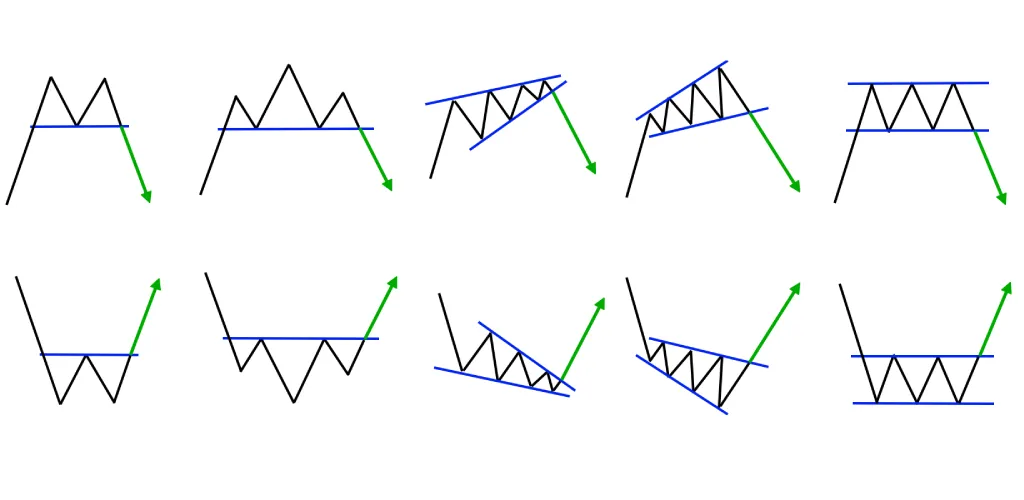
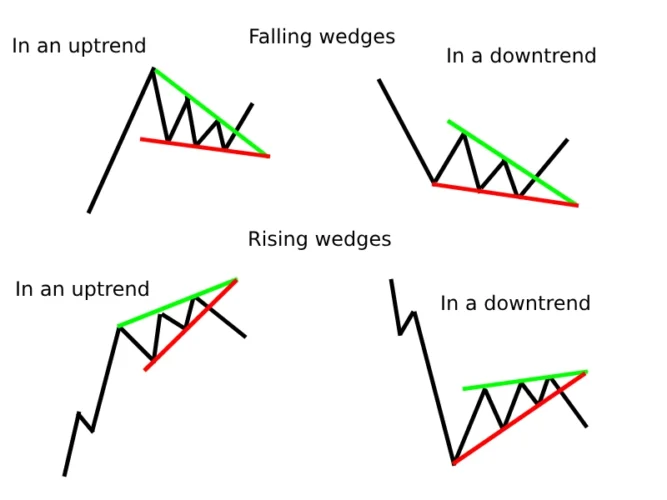
📐 Types of Wedges
1. Rising Wedge 📈
- Slope: Both trendlines angle upward
- Psychology: Buyers getting exhausted at higher prices
- Breakout: Typically bearish (breaks downward)
Common Contexts:
- After uptrend (reversal signal)
- During downtrend (continuation pattern)
2. Falling Wedge 📉
- Slope: Both trendlines angle downward
- Psychology: Sellers losing momentum
- Breakout: Typically bullish (breaks upward)
Common Contexts:
- After downtrend (reversal signal)
- During uptrend (continuation pattern)
🎯 How to Determine: Reversal or Continuation?
The key lies in where the wedge forms:
| Wedge Type | In Uptrend | In Downtrend |
|---|---|---|
| Rising Wedge | Reversal (80%) | Continuation (20%) |
| Falling Wedge | Continuation (20%) | Reversal (80%) |
Pro Tip: The steeper the wedge, the higher probability it’s a reversal pattern.
📈 Trading Wedges: Step-by-Step Strategy
Step 1: Identify the Wedge
- Look for converging trendlines with same slope
- Confirm volume is declining during formation
Step 2: Determine Context
- Is it in established trend? (Check higher timeframe)
- How steep are the angles? (Steeper = more likely reversal)
Step 3: Wait for Breakout
- Rising wedge: Watch for break below support
- Falling wedge: Watch for break above resistance
Step 4: Enter Trade
- Reversal wedge: Enter on breakout with stop beyond wedge
- Continuation wedge: Enter in direction of main trend
Step 5: Set Targets
- Measure widest part of wedge
– Project same distance from breakout point
⚠️ 5 Common Wedge Trading Mistakes
❌ Trading too early (before confirmed breakout)
❌ Ignoring volume (breakouts need confirmation)
❌ Confusing with triangles (wedges have parallel slope)
❌ Overlooking timeframe alignment (check higher TFs)
❌ Forgetting about false breakouts (wait for close beyond wedge)
🔍 Wedges vs Similar Patterns
| Pattern | Trendlines | Slope | Breakout Direction |
|---|---|---|---|
| Wedge | Converging | Same | Usually opposite |
| Triangle | Converging | Different | Either direction |
| Flag | Parallel | Against trend | Continuation |
📌 Key Takeaways
✔ Wedges can be reversal or continuation patterns
✔ Rising wedges typically break downward
✔ Falling wedges typically break upward
✔ Context matters (trend position, steepness)
✔ Always wait for confirmed breakout with volume
Ready to spot wedges? Start scanning charts with these principles in mind!
Recommended Reading
Guide to Volume Price Analysis by Anna Coulling
Technical Analysis of the Financial Markets by John J. Murphy